In unserer Serie zum städtischen Wärmeinseleffekt (UHI) geht es heute nach Asien.
China
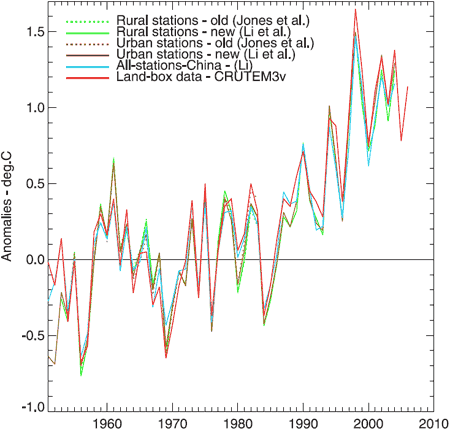
Auf dem Höhepunkt der Klimaalarmwelle strengten sich die IPCC-nahen Webseiten sehr an, den UHI aus der Diskussion herauszuhalten. Es war der Öffentlichkeit schon recht schwer erklärbar, wie es in den Städten der Welt einen enormen UHI-Effekt gebe konnte, er aber statistisch keinen Effekt haben soll. Im Jahr 2008 zog die klimakatastrophale Plattform Skeptical Science ein Beispiel aus China heran, das zeigen sollte, dass der UHI für die Klimakurven angeblich folgenlos wäre:
…investigators have also looked at sites across rural and urban China, which has experienced rapid growth in urbanisation over the past 30 years and is therefore very likely to show UHI. The difference between ideal rural sites compared to urban sites in temperature trends has been very small:
Figure 1. Annual average temperature anomalies. Jones et al (dotted green and brown) is a dataset of 42 rural and 42 urban sites. Li et al (solid green and brown) is an adjusted dataset of 42 rural and 40 urban sites. Li (blue) is a non-adjusted set of 728 stations, urban and rural. CRUTEM3v (red) is a land-only data set (Brohan et al., 2006). This plot uses the 1954–83 base period.
Leider versäumte man es, die Li et al.-Arbeit genauer zu zitieren. Daher bleibt vorerst offen, ob es sich um Li et al. 2007 („Characteristics of urban heat island intensity of Guangzhou in 2005“) handelt. Es gibt so viele Li et al.s – und googlen lässt sich das auch schlecht.
Wie auch immer. Fünf Jahre später sieht die Welt schon wieder ganz anders aus. Im Januar 2013 veröffentlichten Kai Wu und XiuQun Yang im Chinese Science Bulletin eine Studie aus Ostchina, die Unerhörtes herausfand. Die Autoren untersuchten urbane Zentren und fanden für das Yangtze-Gebiet, dass offenbar 36-68% der gesamten Erwärmung der letzten 30 Jahre auf das UHI-Phänomen zurückgeht. Für das Pekinger Gebiet scheinen immerhin 12-24% des Temperaturanstiegs UHI-bedingt zu sein. Im Folgenden die Kurzfassung der Arbeit:
Urbanization and heterogeneous surface warming in eastern China
With the homogeneity-adjusted surface air temperature (SAT) data at 312 stations in eastern China for 1979-2008 and the Defense Meteorological Satellite Program/Operational Linescan System (DMSP/OLS) nighttime light data, the spatial heterogeneities of the SAT trends on different scales are detected with a spatial filtering (i.e. moving spatial anomaly) method, and the impact of urbanization in eastern China on surface warming is analyzed. Results show that the urbanization can induce a remarkable summer warming in Yangtze River Delta (YRD) city cluster region and a winter warming in Beijing-Tianjin-Hebei (BTH) city cluster region. The YRD warming in summer primarily results from the significant increasing of maximum temperature, with an estimated urban warming rate at 0.132–0.250°C per decade, accounting for 36%–68% of the total regional warming. The BTH warming in winter is primarily due to the remarkable increasing of minimum temperature, with an estimated urban warming rate at 0.102–0.214°C per decade, accounting for 12%–24% of the total regional warming. The temporal-spatial differences of urban warming effect may be attributed to the variation of regional climatic background and the change of anthropogenic heat release.
Auch ein Paper von Zhou & Ren im Fachjournal Inter-Research Climate Research aus dem Dezember 2011 zeigte bedeutende UHI-Effekte in China:
Change in extreme temperature event frequency over mainland China, 1961−2008
Based on homogeneity-adjusted daily temperature data from national stations, the spatial and temporal change in extreme temperature events in mainland China have been analyzed for the period 1961−2008. The analysis shows that the numbers of frost days and ice days were significantly reduced, with the most significant reduction generally in northern China for ice days but more extensively across the country for frost days. Summer days and tropical nights significantly increased along the middle and lower reaches of the Yangtze River and in southern Southwest China. The maximum values of Tmax (TXx) and Tmin (TNx) and the minimum values of Tmax (TXn) and Tmin (TNn) generally rose, and TXx and TNx significantly increased in northern China, while TXn and TNn significantly increased across the whole country. A significant reduction at a rate of −8.23 d decade−1 (−3.26 d decade–1) occurred for cool nights (days), and a significant increase at a rate of 8.16 d decade–1 (5.22 d decade–1) occurred for warm nights (days). The reduction of cool nights and cool days occurred mainly in winter, but the increase of warm days and warm nights occurred mostly in autumn and summer. Extreme cold indices were reduced, mainly after the mid-1980s, while extreme warm indices increased remarkably after the mid-1990s. The analysis also shows that, for North China, the urbanization effect on the series of extreme temperature indices was statistically significant for the negative trends of frost days, diurnal temperature range, cool nights and cool days, and for the positive trends of summer days, tropical nights, TNx, TNn, and warm nights.
Der NIPCC zitiert aus dem Paper wie folgt:
„the contributions of the urbanization effect to the overall trends ranged from 10 to 100%, with the largest contributions coming from tropical nights, daily temperature range, daily maximum temperature and daily minimum temperature,“ adding that „the decrease in daily temperature range at the national stations in North China was caused entirely by urbanization.“
Ein anderes Paper von Bian et al. aus dem Februar 2015 im Fachblatt Theoretical and Applied Climatology fand ebenfalls eine massive UHI-Beeinflussung, diesmal in Nordchina:
Urbanization effect on long-term trends of extreme temperature indices at Shijiazhuang station, North China
Based on daily temperature data from an urban station and four rural stations of Shijiazhuang area in Hebei Province, North China, we analyzed the trends of extreme temperature indices series of the urban station (Shijiazhuang station) and rural stations during 1962–2011 and the urbanization effect on the extreme temperature indices of the urban station. The results showed that the trends of annual extreme temperature indices of the urban station and the rural stations are significantly different in the recent 50 years. Urbanization effect on the long-term trends of hot days, cold days, frost days, diurnal temperature range (DTR), extreme maximum temperature, and extreme minimum temperature at the urban station were all statistically significant, reaching 1.10 days/10 years, −2.30 days/10 years, −2.55 days/10 years, −0.20 °C/10 years, 0.16 °C/10 years, and 0.70 °C/10 years, respectively, with the urbanization contributions to the overall trends reaching 100, 38.0, 42.2, 40.0, 94.1, and 47.0 %, respectively. The urbanization effect on trend of ice days was also significant, reaching −0.47 days/10 years. However, no significant urbanization effect on trends of minimum values of maximum temperature and maximum values of minimum temperature had been detected. The urbanization effects in the DTR and extreme minimum temperature series of Shijiazhuang station in wintertime were highly significant.
The Hockey Schtick “übersetzt” dies für den Nichtfachmann:
New paper finds 100% of the trend in number of „hot days“ is artificial, due to poor-siting of thermometers, not global warming
A paper published today in Theoretical and Applied Climatology examines the effect of urbanization on extreme temperature readings in North China and finds statistically significant evidence that urbanization / UHI is responsible for 100% of the artificial trend in number of hot days, and 94.1% of the artificial trend in extreme maximum temperatures. In other words, 100% of the reported trends in the number of hot days are due to poor-siting of temperature stations, and have absolutely nothing to do with alleged man-made global warming.The artificial urbanization contributions to overall trends reported by the authors are:
Urbanization contributions to the overall trends:
hot days 100%
cold days 38%
frost days 42.2%
diurnal temperature range (DTR) 40%
extreme maximum temperature 94.1%
extreme minimum temperature 47%
Die Wärmeinsel von Hongkong wurde von Giridharan et al. 2004 beschrieben:
Daytime urban heat island effect in high-rise and high-density residential developments in Hong Kong
Nearly 60% of electrical energy use in Hong Kong is for space conditioning during summer months. The paper investigates the impact of design-related variables on outdoor micro level daytime heat island effect in residential developments in Hong Kong. The paper hypothesizes that the differences in outdoor temperatures within and between residential developments can be explained by the impact of design-related variables on the overall environment. Case studies of three large housing estates reveal urban heat island effect (UHI) in the order of 1.5 °C within an estate, and 1.0 °C between estates. The results indicate that energy efficient designs can be achieved by manipulating surface albedo, sky view factor and total height to floor area ratio (building massing) while maximizing cross ventilation.
Hochinteressant ist die Arbeit von Yang et al. 2011 aus dem Journal of Geophysical Research. Knapp ein Viertel der regionalen Erwärmung Ostchinas der letzten 30 Jahre geht offenbar auf den UHI zurück:
Observed surface warming induced by urbanization in east China
Monthly mean surface air temperature data from 463 meteorological stations, including those from the 1981–2007 ordinary and national basic reference surface stations in east China and from the National Centers for Environmental Prediction and National Center for Atmospheric Research (NCEP/NCAR) Reanalysis, are used to investigate the effect of rapid urbanization on temperature change. These stations are dynamically classified into six categories, namely, metropolis, large city, medium-sized city, small city, suburban, and rural, using satellite-measured nighttime light imagery and population census data. Both observation minus reanalysis (OMR) and urban minus rural (UMR) methods are utilized to detect surface air temperature change induced by urbanization. With objective and dynamic station classification, the observed and reanalyzed temperature changes over rural areas show good agreement, indicating that the reanalysis can effectively capture regional rural temperature trends. The trends of urban heat island (UHI) effects, determined using OMR and UMR approaches, are generally consistent and indicate that rapid urbanization has a significant influence on surface warming over east China. Overall, UHI effects contribute 24.2% to regional average warming trends. The strongest effect of urbanization on annual mean surface air temperature trends occurs over the metropolis and large city stations, with corresponding contributions of about 44% and 35% to total warming, respectively. The UHI trends are 0.398°C and 0.26°C decade−1. The most substantial UHI effect occurred after the early 2000s, implying a significant effect of rapid urbanization on surface air temperature change during this period.
Zwei Jahre später untersuchte eine Forschergruppe um Yuting He 69 Wetterstationen im Umkreis von einigen 100 km südlich von Peking (Abbildung 2). Die Studie erschien im Juli 2013 im Fachblatt Advances in Atmospheric Sciences und ging der Frage nach, wie hoch der UHI-Anteil an der Gesamterwärmung der Flachlandregion in den letzten 30 Jahren war. Insgesamt wurde es um 0,9°C wärmer während dieser Zeit, wovon die Forscher satte 44% dem UHI zurechnen. Im Folgenden die Kurzfassung der Arbeit:
Detecting urban warming signals in climate records
Determining whether air temperatures recorded at meteorological stations have been contaminated by the urbanization process is still a controversial issue at the global scale. With support of historical remote sensing data, this study examined the impacts of urban expansion on the trends of air temperature at 69 meteorological stations in Beijing, Tianjin, and Hebei Province over the last three decades. There were significant positive relations between the two factors at all stations. Stronger warming was detected at the meteorological stations that experienced greater urbanization, i.e., those with a higher urbanization rate. While the total urban area affects the absolute temperature values, the change of the urban area (urbanization rate) likely affects the temperature trend. Increases of approximately 10% in urban area around the meteorological stations likely contributed to the 0.13°C rise in air temperature records in addition to regional climate warming. This study also provides a new approach to selecting reference stations based on remotely sensed urban fractions. Generally, the urbanization-induced warming contributed to approximately 44.1% of the overall warming trends in the plain region of study area during the past 30 years, and the regional climate warming was 0.30°C (10 yr)−1 in the last three decades.

Abbildung 2: Untersuchungsgebiet und ausgewertete Wetterstationen der UHI-Studie von Yuting He und Kollegen. Abbildungsquelle: He et al. 2013.
Eine weitere Arbeit zum UHI in China stammt von Tian et al. 2013, in der die Wärmeinsel von Shenzen beschrieben wird. Der UHi hat hier vor allem die Nacht- und Wintertemperaturen nach oben getrieben.
Südkorea
Beeindruckende Resultate sind auch aus Südkorea zu vermelden. Maeng-Ki Kim und Seonae Kim veröffentlichten im Oktober 2011 im Fachblatt Atmospheric Environment eine Studie, die fand, dass mehr als die Hälfte der in Südkorea während der letzten 55 Jahren verzeichneten Erwärmung von 1,37°C auf das Konto des UHI geht, nämlich ein Anteil von 0,77°C. Die globale Erwärmung steuerte dagegen nur 0,60°C bei. Im Folgenden die Kurzfassung der Arbeit:
Quantitative estimates of warming by urbanization in South Korea over the past 55 years (1954–2008)
The quantitative values of the urban warming effect over city stations in the Korean peninsula were estimated by using the warming mode of Empirical Orthogonal Function (EOF) analysis of 55 years of temperature data, from 1954 to 2008. The estimated amount of urban warming was verified by applying the multiple linear regression equation with two independent variables: the rate of population growth and the total population. Through the multiple linear regression equation, we obtained a significance level of 0.05% and a coefficient of determination of 0.60. This means that it is somewhat liable to the estimated effects of urbanization, in spite of the settings of some supposition. The cities that show great warming due to urbanization are Daegu, Pohang, Seoul, and Incheon, which show values of about 1.35, 1.17, 1.16, and 1.10°C, respectively. The areas that showed urban warming less than 0.2°C are Chupungnyeong and Mokpo. On average, the total temperature increase over South Korea was about 1.37°C; the amount of increase caused by the greenhouse effect is approximately 0.60°C, and the amount caused by urban warming is approximately 0.77°C.
Die Südkorea-Studie erlaubt uns, einen interessanten Test durchzuführen. Ob der hohe UHI-Anteil wohl in der NASA-Temperaturdatenbank „GISS“ korrigiert ist? Die GISS-Daten durchlaufen eine ganze Reihe von Korrekturverfahren, darunter auch eine UHI-Anpassung. Paul Homewood hat 2013 auf WUWT die Probe aufs Exempel gemacht und die Südkorea-Korrekturen des GISS-Systems nachgeschlagen. Das Ergebnis ist enttäuschend. Die NASA-Temperatur-Verwalter ziehen in den Großstadtstationen Südkoreas lediglich einen UHI von 0,05°C ab.
Japan
Für Tokio hat die BEST-Studiengruppe der University of California in Berkeley (in Wickham et al. 2013) eine spannende Graphik veröffentlicht. Die Temperaturen von Tokio und des Umlandes verliefen bis 1945 parallel zueinander. Zwischen 1945 und 1960 schoss das Thermometer in Japans Hauptstadt dann aber wie eine Rakete nach oben, während die Temperaturen im Umland stagnierten (Abbildung 3). Im Anschluss daran ähnelte sich der Temperaturverlauf dann wieder. Die starke UHI-Änderung ereignete sich in einer Zeitspanne von nur 15 Jahren, während der die Erwärmungsrate Tokios signifikant gesteigert wurde. Davor und danach besaßen Umland und Hauptstadt vermutlich eine ähnliche Erwärmungsrate. Der UHI-Schub 1950-1960 erfolgte deutlich vor dem Satellitenzeitalter, das erst 1979 begann.
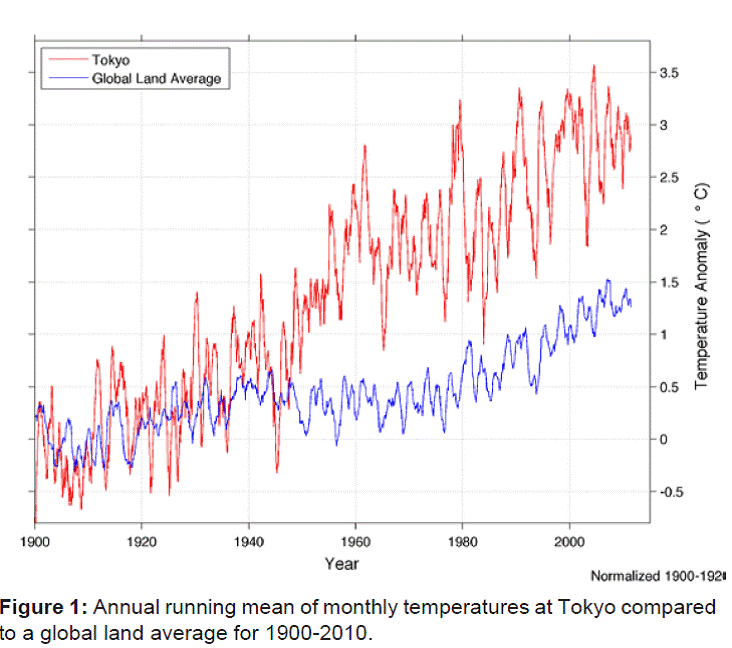
Abbildung 3: Temperaturentwicklung von Tokio (rot) und der globalen Durchschnittstemperatur (blau). Quelle: Wickham et al. 2013
Die Anschlussfrage: Was passierte im Nachkriegs-Tokio der 1950er Jahre, dass der UHI-Effekt so dramatisch zunahm? Ein Blick auf die Bevölkerungsentwicklung bringt Aufklärung: Die Einwohnerzahl verdreifachte sich, von 3 Millionen auf 9 Millionen (Abbildung 4).
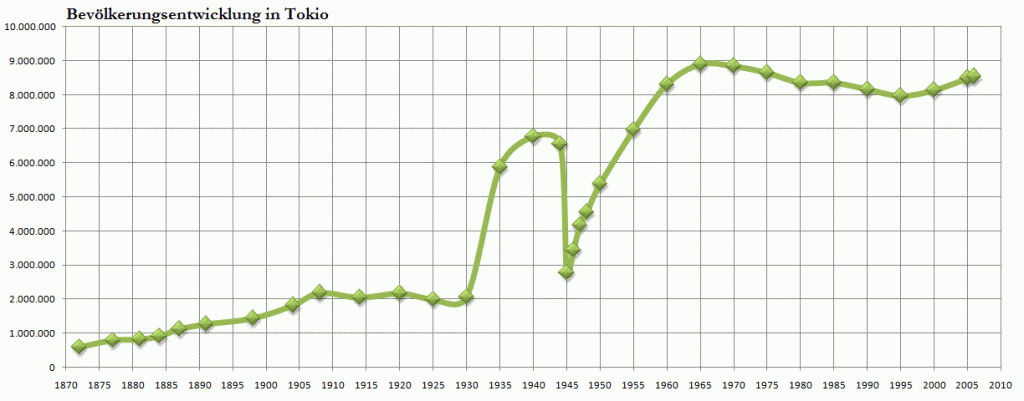
Abbildung 4: Bevölkerungsentwicklung Tokios. Quelle: Wikipedia.
UHI-Änderungen synchron zur Bevölkerungsentwicklung
Aus dem Tokioer Beispiel entwickeln wir jetzt eine Arbeitshypothese: Der UHI-Effekt ändert und verstärkt sich immer besonders dann, wenn die Bevölkerungszahl einer Metropole nach oben schießt. Mehr Einwohner bedeutet auch starker Zuwachs der Flächennutzung, hohe Bautätigkeit und eine hohe Produktion an Abwärme. Der steigende UHI erhöht auch die Erwärmungsrate in diesem Zeitabschnitt. Stagnation der Bevölkerungszahl hingegen bedeutet, dass der UHI konstant bleibt und keinen Einfluss auf den Erwärmungstrend hat. Am Beispiel Deutschland wollen wir die Hypothese anwenden: Basierend auf Daten des Statistischen Bundesamtes gab es zwei Phasen, in denen die Bevölkerung stark angestiegen ist: ein starker Anstieg 1870-1910 und ein geringerer 1950-1970 (Abbildung 5). Beide Steigerungsphasen liegen vor dem Satellitenzeitalter, so dass es wenig wundert, dass der UHI laut Satellitenmessungen seit 1979 keinen Einfluss auf die Erwärmungsrate (mehr) hat. Besonders 1870-1910 könnte der bedeutende UHI-Zuwachs die Erwärmungsrate in Deutschland maßgeblich nach oben gedrückt haben.
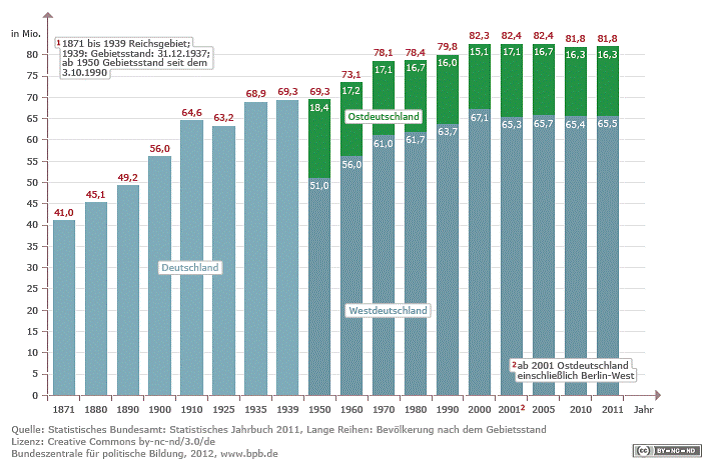
Abbildung 5: Entwicklung der Bevölkerung in Deutschland. Quelle: Statistisches Bundesamt, Bundeszentrale für Politische Bildung.
Indonesien
Tokairin et al. (2010) beschrieben den UHI aus Jakarta, wo die Temperatur in den Randbereichen Jakartas durch die fortschreitende Urbanisierung stark angestiegen ist. Auch Widyasamratri et al. (2014) beschäftigten sich mit dem UHI in der Hauptsstadt Indonesiens und fanden Temperaturunterschiede von bis zu 3°C gegenüber dem Umland.
Indien
Mallick und Rahman (2012) beschrieben im Fachblatt Current Science den UHI aus Neu-Delhi in Indien. In ihrer Arbeit präsentieren die Autoren auch einen Zusammenhang zwischen der Bevölkerungsdichte und der Intensität des UHI (Abbildung 6). Es handelt sich um einen logarithmischen Verlauf, bei dem sich die größten Temperaturveränderungen zu Beginn der urbanen Entwicklung bei kleinen Bevölkerungsdichten ereignen.
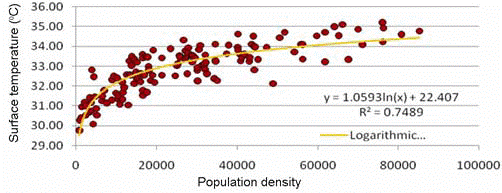
Abbildung 6: Bevölkerungsdichte und Landoberflächentemperatur in Neu-Delhi. Quelle: Mallick und Rahman (2012).
Hier die Erläuterung zum Diagramm aus Mallick und Rahman (2012):
Figure 4 shows the correlation between surface temperature and population density. A strong positive correlation between the two can be seen. The value of logarithmic regression (R2 ) is 0.748. The logarithmic regression equation between surface temperature and population density is Y = 1.059ln × Pop-density + 22.40. It means that with the increase in population density, surface temperature also increases. Furthermore, it is possible to predict night-time surface temperature on the basis of known population density. The substantial amount of variance of temperature rise in cities could be explained as a function of population growth. The growing cities showed the highest warming rates and square root of the population number as the most representative factors for the urban contribution to temperature change4 . Oke21 used the empirical method to represent the relationship between urban–rural temperatures as concentration on population. It is not easy to separate many contributors to the problem. However, one of the most noticeable and one that has proven to have an extremely strong correlation with the UHI phenomenon or urban surface temperature is the population density of major cities32. The present study demonstrates a close relationship between the population density, built-up area and surface temperature. The statistical analysis of nighttime surface temperature with population density indicates that population growth tends to contribute to the urban surface temperature rise or UHI intensity and also to the micro-climate of Delhi. […] This study clearly shows spatial variation of LST [land surface temperature] over entire Delhi. By superposing the population density map of Delhi over the surface temperature map, it can be clearly seen that high population density is one of the main contributing factors for the high surface temperature, UHI intensity and also micro-climate of Delhi. To assess and address the issue of micro-climate and also to mitigate the impact of UHI on the city population, the outcome of such types of studies may be useful.
Türkei
Ozdemir et al. (2012) fanden auf der Anatolischen Halbinsel im Untersuchungszeitraum von 1965 und 2006 einen enormen UHI-Effekt:
Quantification of the urban heat island under a changing climate over Anatolian Peninsula
The Anatolian Peninsula is located at the confluence of Europe, Asia, and Africa and houses 81 cities of which 79 of them have population over 100,000. We employed some criteria to select the cities from the 81 cities. After accomplishing all the criteria, eight cities were remaining for the study. Nonparametric Mann–Kendall test procedure was employed for the urban and rural stations of these cities to detect the long-term change in temperature trends. Statistical analysis of daily minimum temperatures for the period between 1965 and 2006 suggest that there is no statistically significant increase in rural areas. In contrast to the findings of the previous studies, however, all the urban sites and difference between urban and rural pairs show significant increase in temperatures, a strong indication for the existence of urban heat island (UHI) affect over the region. Regional Climate Model was also utilized to assess the changes in temperature by the end of century for the region. The findings suggest that an increase of up to 5°C is possible. Climate change effects enforced with UHI have the potential to cause serious problems for the entire region and hence needs to be studied thoroughly.
Israel
Abschließen möchten wir unsere UHI-Asienrundreise im israelischen Tel Aviv. Von dort berichteten Saaroni et al. (2000) über UHI-bedingte Wärmeinseln von bis zu 5°C an einigen Tagen.
Zwischenfazit
Ganz anders als in Europa oder den USA fanden Studien in China und Südkorea einen enormen Einfluss des UHI auf die regionalen Erwärmungstrends. Die große Frage ist, wie man von den untersuchten Fallstudien auf die Gesamtfläche Asiens erweitern könnte. Der Vergleich von GISS-Oberflächentemperaturmessungen mit UHI-freien Satellitenmessungen (Abbildung 7) deutet an, dass vielleicht bis zu ein Drittel der in Asien gemessenen Erwärmung während der letzten 30 Jahre dem UHI zuzuschreiben ist. Diese Effekte sind in den asiatischen und globalen Statistiken noch weitgehend unberücksichtigt und bedürften in diesem Falle einer Korrektur.
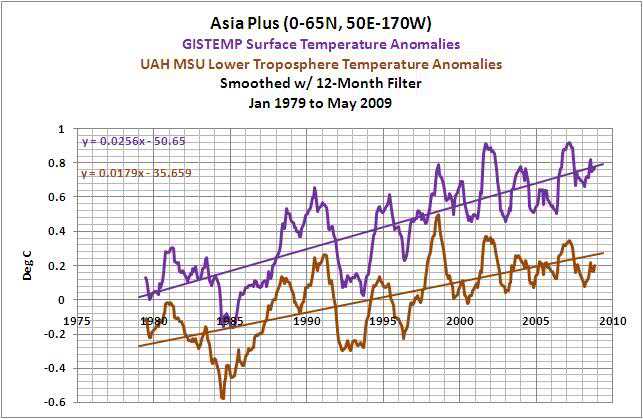
Abbildung 7: Die GISS-Oberflächentemperaturen weisen in Asien einen spürbar stärkeren Erwärmungstrend auf, als die UHI-freien Satellitenmessungen. Quelle: Bob Tisdale.
Weshalb unterscheiden sich die Resultate in Asien so sehr von Europa und den USA? Die asiatischen Tigerstaaten sind erst sehr spät industrialisiert worden und ihre Stadtentwicklung hinkt gegenüber Europa, den USA und Japan um etliche Jahrzehnte hinterher. Das rasche Wachstum in Asien konnte daher die Erwärmungstrends der letzten Jahrzehnte maßgeblich in der Region verstärken. In Europa und den USA ist vermutlich Ähnliches im späten 19. Jahrhundert und in der ersten Hälfte des 20. Jahrhunderts geschehen. Damals gab es aber noch keine Satelliten, die diese UHI-bedingten Erwärmungsverstärker hätten erfassen können.
Auch der empirisch ermittelte logarithmische Verlauf des UHI-Effekts spielt hier eine Rolle. Die größten Temperaturveränderungen ereignen sich offenbar zu Beginn der urbanen Entwicklung, bei kleinen Bevölkerungsdichten. In Europa und den USA liegt dieses rasante Frühwachstum der Städte mehr als 80 Jahre zurück.
————————-
Alle Teile unserer UHI-Serie im Überblick:
Teil 1: Der Elefant im Raum: Ist der Städtische Wärmeinsel-Effekt vernachlässigbar?
Teil 2: Großer städtischer Wärmeinseleffekt – kleine Wirkung? Wir fragen beim Deutschen Wetterdienst nach
Teil 4: Städtischer Wärmeinseleffekt: Blick nach Europa
Teil 5: Städtischer Wärmeinseleffekt: Blick nach Amerika
Teil 6: Städtischer Wärmeinseleffekt: Blick nach Asien. Eine faustdicke Überraschung!

