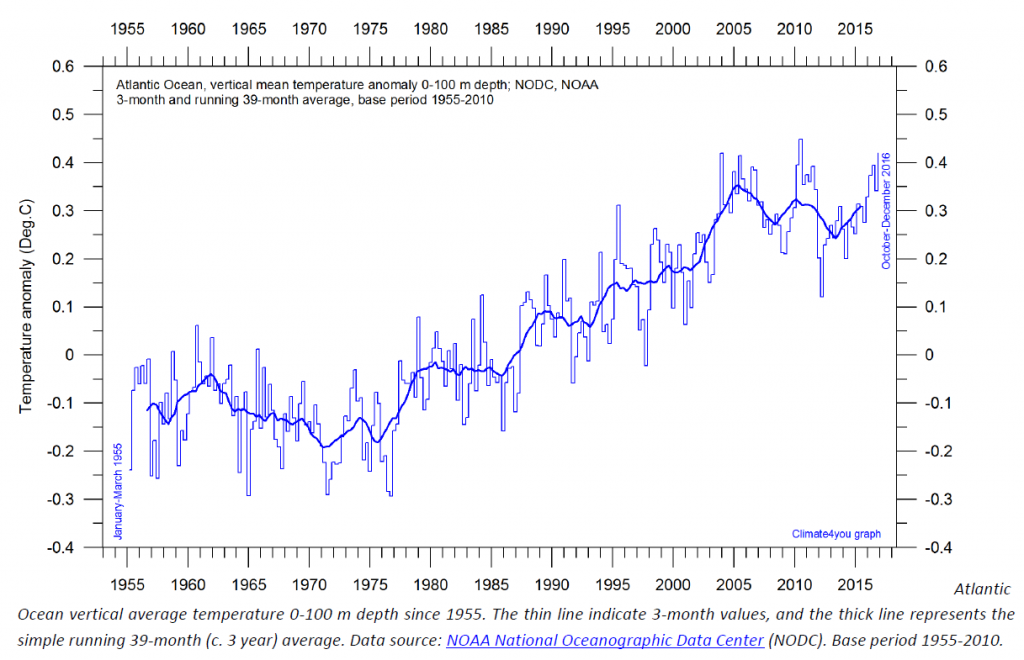
Wir wollen uns heute die ozeanische Wärme im Atlantik vornehmen. Aus dem neuesten Climate4You Newsletter (pdf hier) besorgen wir uns die Wärmeinhalts-Kurve für die letzten 60 Jahre, die für die obersten 100 m der atlantischen Wassermassen gilt:

Abb. 1: Atlantische Wärmeinhalts-Kurve für die letzten 60 Jahre (oberste 100 m der atlantischen Wassermassen). Graphik: Climate4You.
Schön zu sehen: In den letzten 13 Jahren hat sich der Atlantik nicht weiter aufgeheizt. Die Graphik zeigt eine große Treppenstufe: Plateau 1955-1985, dann Anstieg, dann ab 2004 wieder ein Plateau. Die aktuell fehlende Erwärmung der atlantischen Oberflächenwässer war auch Thema einer Arbeit von Somavilla und Kollegen, die im März 2016 in den Geophysical Research Letters erschien. Sie erklären, die Hitze hätte sich einfach von den oberen Stockwerken des Atlantiks in die Tiefenschichten verlagert:
Mid-2000s North Atlantic shift: Heat budget and circulation changes
Prior to the 2000s, the North Atlantic was the basin showing the greatest warming. However, since the mid-2000s during the so-called global warming hiatus, large amounts of heat were transferred in this basin from upper to deeper levels while the dominance in terms of atmospheric heat capture moved into the Indo-Pacific. Here we show that a large transformation of modal waters in the eastern North Atlantic (ENA) played a crucial role in such contrasting behavior. First, strong winter mixing in 2005 transformed ENA modal waters into a much saltier, warmer, and denser variety, transferring upper ocean heat and salt gained slowly over time to deeper layers. The new denser waters also altered the zonal dynamic height gradient reversing the southward regional flow and enhancing the access of saltier southern waters to higher latitudes. Then, the excess salinity in northern regions favored additional heat injection through deep convection events in later years.
Wenn man sich dann aber die Temperaturanomaliekarten im Supplement der Arbeit (Fig. S1) anschaut, erkennt man, wie heterogen diese Trends eigentlich wirklich sind. Müssen wir also weiter im Auge behalten. Die Wärmeumverteilung war bereits Thema eines Papers von Desbruyères und Kollegen 2014 in den Geophysical Research Letters:
Full-depth temperature trends in the northeastern Atlantic through the early 21st century
The vertical structure of temperature trends in the northeastern Atlantic (NEA) is investigated using a blend of Argo and hydrography data. The representativeness of sparse hydrography sampling in the basin mean is assessed using a numerical model. Between 2003 and 2013, the NEA underwent a strong surface cooling (0–450 m) and a significant warming at intermediate and deep levels (1000 m to 3000 m) that followed a strong cooling trend observed between 1988 and 2003. During 2003–2013, gyre-specific changes are found in the upper 1000 m (warming and cooling of the subtropical and subpolar gyres, respectively), while the intermediate and deep warming primarily occurred in the subpolar gyre, with important contributions from isopycnal heave and water mass property changes. The full-depth temperature change requires a local downward heat flux of 0.53 ± 0.06 W m−2 through the sea surface, and its vertical distribution highlights the likely important role of the NEA in the recent global warming hiatus.
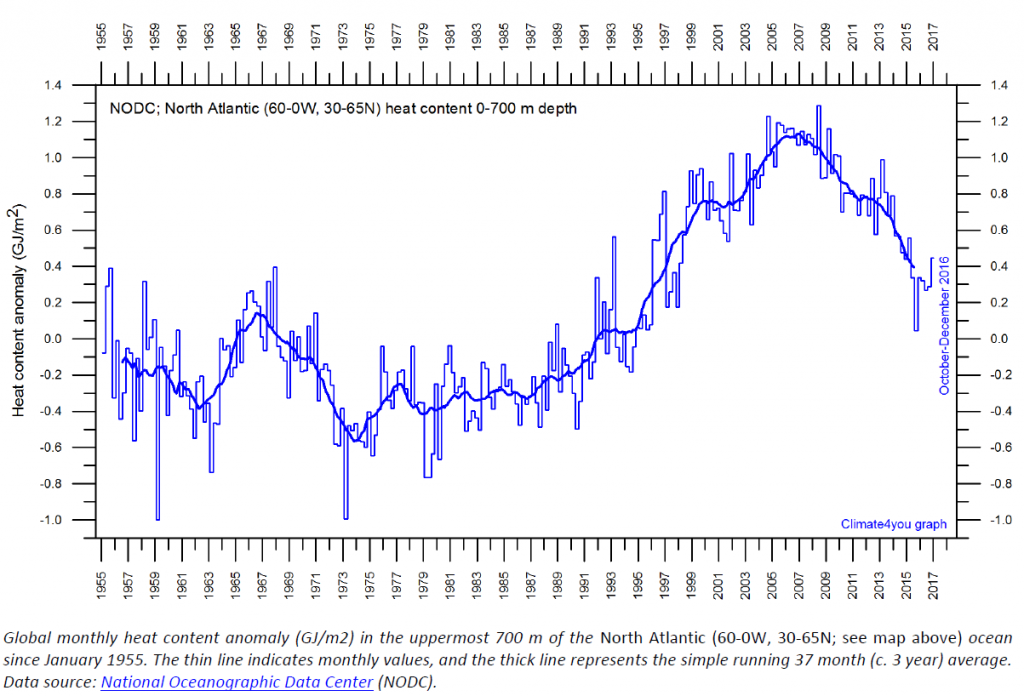
Die erwähnte Abkühlung im Nordatlantik wollen wir uns wieder in einer aktuellen Graphik von Climate4You anschauen:

Abb. 2: Nordatlantische Wärmeinhalts-Kurve für die letzten 60 Jahre (oberste 700 m der nordatlantischen Wassermassen). Graphik: Climate4You.


