Wer kennt sie nicht, die Märchen der Gebrüder Klimagrimm: Die Dürren würden angeblich immer häufiger und intensiver werden. Früher sei alles besser gewesen: immer schön nass, gerade genug Wasser, nicht zu viel und nicht zu wenig. Wer so etwas behauptet, hat keinen blassen Schimmer von der Klimageschichte. Um diese zu studieren, müsste man aber die Fachjournale durchstöbern – viel zu anstrengend. Lieber lesen wir weiter die Klimagrusel-Stories in der Tagespresse. Wir wollen Ihnen das Blättern durch unzählige Journals ersparen. Mit dem heutigen Beitrag starten wir eine Serie zur Kleinen Dürrekunde. Einmal um den Globus und wieder zurück. Beginnen möchten wir zuhause, in Europa.
Auf der Iberischen Halbinsel traten im 8. und 9. Jahrhundert nach Christus schwere Dürrephasen auf, wie eine Auswertung alter maurischer Auswertungen durch ein Team um Fernando Domínguez-Castro ergab. Von 971-975 war hingegen Schnee und Hagel häufiger als heute. Im Abstract der Arbeit, die im März 2014 in The Holocene erschien, heißt es:
Climatic potential of Islamic chronicles in Iberia: Extreme droughts (ad 711–1010)
From ad 711 to 1492, several regions in Iberia were under Muslim ruling. This Al-Andalus civilization generated a large amount of documentation during those centuries. Unfortunately, most of the documents are lost. The surviving Arabic documentary sources have never been studied from a climate perspective. In this paper, we present the first attempt to retrieve climate evidence from them. We studied all the Islamic chronicles (documents written by Islamic historians that narrate the social, political and religious history) available for the period ad 711–1010. It is shown that these sources recorded extreme events with a high temporal and spatial resolution. We identified three severe droughts, ad 748–754, ad 812–823 and ad 867–879, affecting Al-Andalus. We also noticed that the weather in Cordoba during the period ad 971–975 showed a higher frequency of snow and hail than current climate. The possibility of obtaining long continuous series from this type of source seems highly difficult.
Nur einen Monat später berichtete eine Gruppe um Francisca Navarro-Hervás im selben Journal über eine schwere iberische Dürrephase von anderthalb Jahrhunderten um 4550-4400 Jahre vor heute:
Evaporite evidence of a mid-Holocene (c. 4550–4400 cal. yr BP) aridity crisis in southwestern Europe and palaeoenvironmental consequences
Sedimentological evidence for an abrupt dry spell in south-eastern Spain during the middle Holocene, from c. 4906 to 4384 cal. yr BP, is presented. This phase was determined primarily from halite beds deposited between muddy slimes in a lagoon system of Puerto de Mazarrón (Murcia province) with a peak phase from c. 4550 to 4400 cal. yr BP. A multi-core, multi-proxy study of 20 geotechnical drills was made in the lagoon basin to identify the main sedimentary episodes and depositional environments. The results suggest that this halite bed, more than 80 cm thick, was conditioned by climate change and was accompanied by a generalized drying-out of the basin. Halite precipitation was linked with palaeoecological changes, including forest and mesophyte depletions and increasing cover and diversity of xerophytic plant species. Archaeological evidence indicates a demise of the population at this period probably due to resource exhaustion. An overall picture of the biostratigraphy and palaeoclimates of the region is given in a broader geographical context.
Castro und Kollegen (2015) untersuchten ein Moor in der spanischen Serra do Xistral und fanden in den letzten 5300 Jahren einen regen Wechsel zwischen 10 Feuchtperioden, getrennt durch Trockenphasen:
Climate change records between the mid- and late Holocene in a peat bog from Serra do Xistral (SW Europe) using plant macrofossils and peat humification analyses
To implement models of global change, information from peripheral regions and concerning the distinction between global and local events is needed. In this context, we studied the occurrence of hydrological changes over the last 5300 years in the southern most European area of active blanket bogs. The reconstruction of the bog surface wetness was performed on the basis of the analysis of plant macrofossils and peat humification. To interpret these proxies, the current botanical composition of the bog and the ecological behavior of the different plant species were used. From its present ecological behavior, we have established the main indicator species for different bog surface wetness. The seeds of Juncus bulbosus and Drosera rotundifolia, which were significantly correlated with the humification index, as well as the seeds and rhizomes of Eriophorum angustifolium, were the primary indicators for wetness. The Sphagnum species are not abundant, and most are restricted to wet and damp periods. The concordance between both proxies, in spite of certain discrepancies, allowed us to estimate the chronological sequence of hydrological changes along the bog profile. We have differentiated 10 wet periods during which the bog surface could be flooded or wet (5300–4850; 4350–3900; 3550–3350; 3150–3050; 2700–2450; 2250–2150; 1950–1300; 1150–1050; 900–800 and 700–20 cal. yr. BP). These identified wet periods are in agreement with previous paleoclimate studies with different spatial scales and proxies.
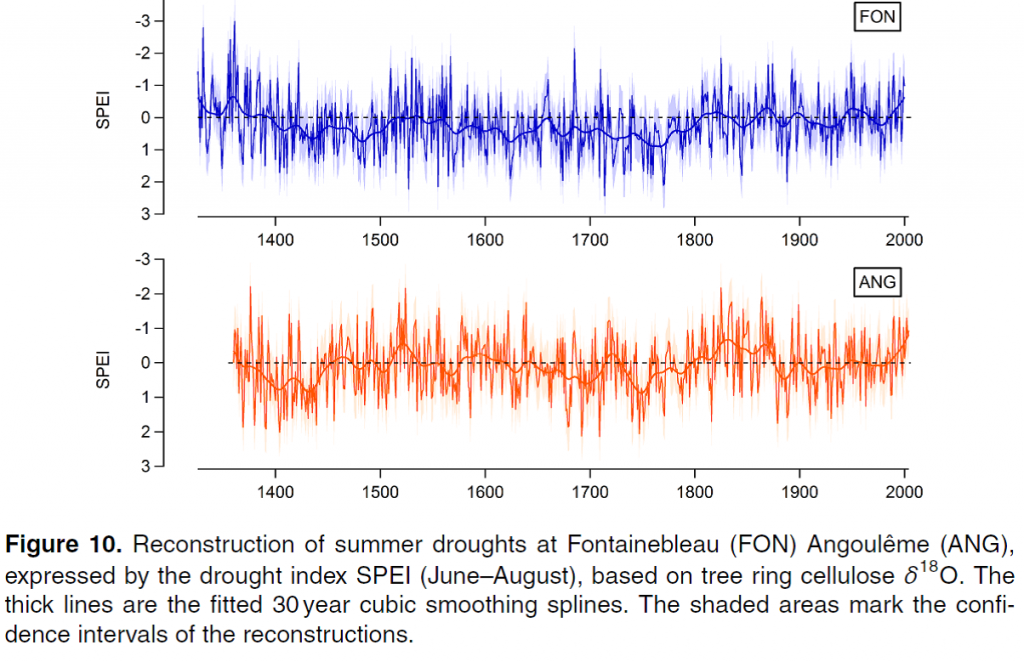
Weiter in Frankreich. Labuhn und Kollegen veröffentlichten im November 2015 in Climate of the Past Discussions eine Analyse der französischen Sommerdürren der letzten 700 Jahre. Überraschend: Einen Langzeittrend gibt es nicht, dafür stark ausgeprägte natürliche Schwankungen (Abb. 1). Die Entwicklung der letzten Jahrzehnte passt bestens ins Bild der natürlichen Variabilität, die möglicherweise von Ozeanzyklen (NAO, AMO) angetrieben sein könnte.

Abbildung 1: Dürreentwicklung in Frankreich der letzten 700 Jahre. Aus Labuhn et al. 2015.
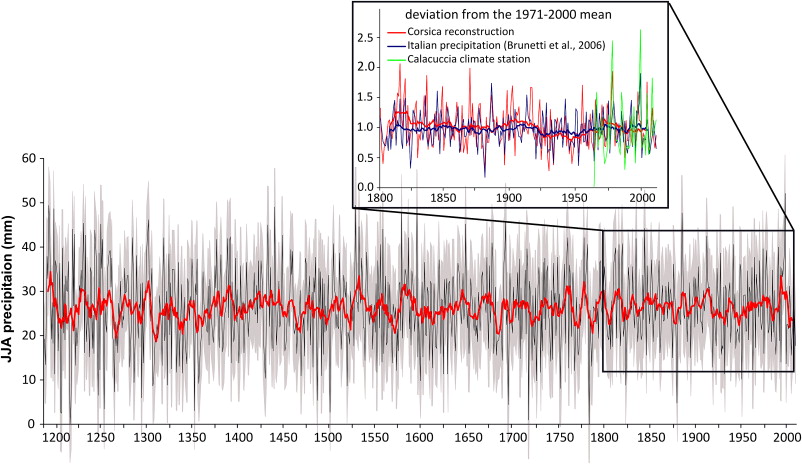
Bereits im Oktober 2014 hatte eine Gruppe um Sonja Szymczak in den Quaternary Science Reviews eine Dürrerekonstruktion der letzten 800 Jahre für Korsika vorgestellt. Fazit auch hier: Kein Trend! Das Dürregeschehen der letzten Jahrzehnte fügt sich nahtlos in die bekannte natürliche Dynamik der letzten Jahrhunderte ein (Abb. 2).

Abbildung 2: Sommer-Niederschläge auf Korsika während der letzten 800 Jahre. Aus: Szymczak et al. 2014.
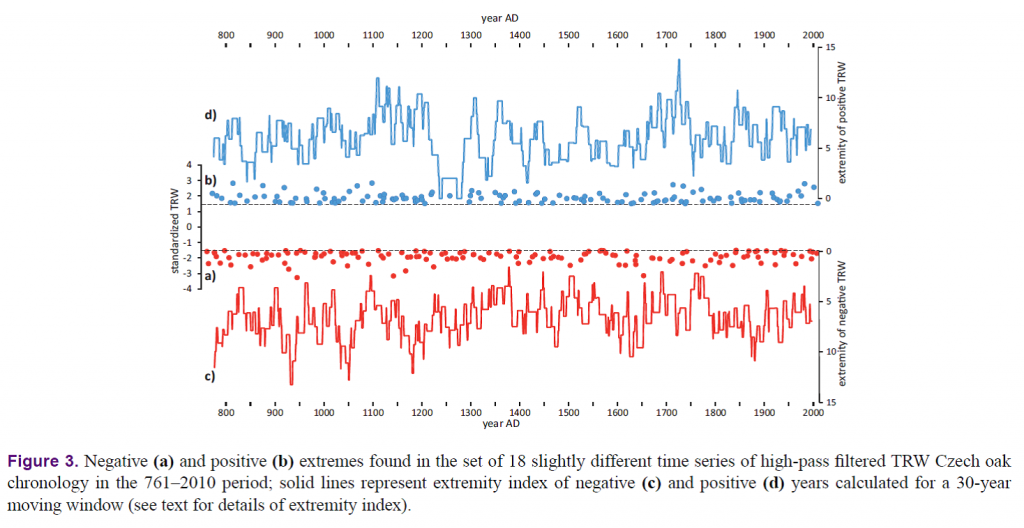
Springen wir weiter in die Tschechische Republik. Im Oktober 2015 publizierten Dobrovolný et al. in Climate of the Past von hier eine Dürrerekonstruktion für die letzten 1250 Jahre. Wiederum fallen Schwankungen im Bereich der bekannten Ozeanzyklen auf, von einem Trend ist jedoch keine Spur (Abb. 3). Die Entwicklung der letzten Jahrzehnte fällt voll und ganz in den Bereich der natürlichen Schwankungsbreite.

Abb. 3 Niederschlagsentwicklung in der Tschechischen Republik seit 761 n. Chr. Ausschläge der roten Kurve („negative extremes“) nach unten markiert Dürren. Aus: Dobrovolný et al. 2015.
Nun nach Skandinavien. Krstina Seftgen & Team schauten sich Dürren, Überflutungen und anderes finnisches Extremwetter für die letzten 1000 Jahre an. In der im Juni 2015 in Climate Dynamics erschienenen Arbeit dokumentieren die Autoren das 17. Jahrhundert als am extremwetterreichsten. Das 20. und frühe 21. Jahrhundert war in keinster Weise besonders im Kontext der letzten 1000 Jahre. Hier ein Auszug aus der Kurzfassung der Arbeit:
The reconstruction gives a unique opportunity to examine the frequency, severity, persistence, and spatial characteristics of Fennoscandian hydroclimatic variability in the context of the last 1,000 years. The full SPEI reconstruction highlights the seventeenth century as a period of frequent severe and widespread hydroclimatic anomalies. Although some severe extremes have occurred locally throughout the domain over the fifteenth and sixteenth centuries, the period is surprisingly free from any spatially extensive anomalies. The twentieth century is not anomalous in terms of the number of severe and spatially extensive hydro climatic extremes in the context of the last millennium.
Ein Blick in die Dürregeschichte sollte für jeden Redakteur zum Pflichtprogramm werden, bevor er über aktuelle Dürren schreibt. Ein neuer europäischer Dürreatlas liefert eine gute Grundlage, wie Spiegel Online am 6. November 2015 meldete:
Klimageschichte: Atlas zeigt Europas Dürre-Katastrophen
Millionen Menschen starben in den Katastrophen: Eine Karte zeigt, wann Europa von schwerer Dürre getroffen wurde – erstaunlich häufig.
Die Leute mussten Hunde und Pferde essen. Doch bald gab es gar keine Nahrung mehr. Millionen Menschen starben im Großen Hunger von 1315 bis 1322 in Europa. Ursache war eine tödliche Witterung, wie sie in der Geschichte des Kontinents beachtlich häufig wiederkehrte. Aus der Analyse alter Baumstämme haben Forscher die Geschichte von Dürrekatastrophen rekonstruiert. Jeder Baumring lässt sich eindeutig einem Jahr zuordnen. Aus der Breite von Jahresringen im Holz lesen Experten Niederschlag und Temperatur. Der neue Dürre-Atlas der Alten Welt bietet auf Basis solcher Baumringanalysen einen Rückblick in die Klimageschichte Europas, des Nahen Ostens und Nordafrikas der vergangenen zwei Jahrtausende. Die Klimadaten sind das Abbild gigantischer Katastrophen. Sie zeigen im 14. Jahrhundert viele kalte Sommer. 1314 kamen schwere Regenfälle und ein harter Winter hinzu – auf Jahre hinaus mangelte es an Ernte.Drückende Hitzewellen
Weiterlesen auf Spiegel Online.
Im Folgenden die dazugehörige Pressemitteilung der Columbia University:
New Drought Atlas Maps 2,000 Years of Climate in Europe
Completes the First Big-Picture View Across Northern Hemisphere
The long history of severe droughts across Europe and the Mediterranean has largely been told through historical documents and ancient journals, each chronicling the impact in a geographically restricted area. Now, for the first time, an atlas based on scientific evidence provides the big picture, using tree rings to map the reach and severity of dry and wet periods across Europe, and parts of North Africa and the Middle East, year to year over the past 2,000 years.
Together with two previous drought atlases covering North America and Asia, the Old World Drought Atlas significantly adds to the historical picture of long-term climate variability over the Northern Hemisphere. In so doing, it should help climate scientists pinpoint causes of drought and extreme rainfall in the past, and identify patterns that could lead to better climate model projections for the future. A paper describing the new atlas, coauthored by scientists from 40 institutions, appears today in the journal Science Advances.
„The Old World Drought Atlas fills a major geographic gap in the data that’s important to determine patterns of climate variability back in time,“ said Edward Cook, cofounder of the Tree Ring Lab at Columbia University’s Lamont-Doherty Earth Observatory, and leader of all three drought-atlas projects. „That’s important for understanding causes of megadroughts, and it’s important for climate modelers to test hypotheses of climate forcing and change.“ For example, if Europe had a wet year north of the Alps and a dry year to the south, that provides clues to circulation patterns and suggests influence from the North Atlantic Oscillation, one of the primary sources of climate variability affecting patterns in Europe. „You can’t get that from one spot on a map,“ Cook said. „That’s the differentiator between the atlas and all these wonderful historic records – the records don’t give you the broad-scale patterns.“
The new atlas could also improve understanding of climate phenomena like the Atlantic Multi-decadal Oscillation, a variation in North Atlantic sea-surface temperatures that hasn’t been tracked long enough to tell if it is a transitory event, forced by human intervention in the climate system, or a natural long-term oscillation. By combining the Old World Drought Atlas with the Asia and North America atlases, climatologists and climate modelers may also discover other sources of internal climate variability that are leading to drought and wetness across the Northern Hemisphere, Cook said. In the Science Advances paper, Cook and his coauthors compare results from the new atlas and its counterparts across three time spans: the generally warm Medieval Climate Anomaly (1000-1200); the Little Ice Age (1550-1750); and the modern period (1850-2012).
The atlases together show persistently drier-than-average conditions across north-central Europe over the past 1,000 years, and a history of megadroughts in the Northern Hemisphere that lasted longer during the Medieval Climate Anomaly than they did during the 20th century. But there is little understanding as to why, the authors write. Climate models have had difficulty reproducing megadroughts of the past, indicating something may be missing in their representation of the climate system, Cook said. The drought atlases provide a much deeper understanding of natural climate processes than scientists have had to date, said Richard Seager, a coauthor of the paper and a climate modeler at Lamont-Doherty Earth Observatory.
„Climate variability tends to occur within patterns that span the globe, creating wet conditions somewhere and dry conditions somewhere else,“ said Seager. „By having tree ring-based hydroclimate reconstructions for three northern hemisphere continents, we can now easily see these patterns and identify the responsible modes of variability.“ The hemispheric scale adds to the potential uses of what was already the gold standard of paleo-hydroclimate research, said Sloan Coats, a climate dynamicist at the University of Colorado who studies megadroughts using the atlases. „The fact that the drought atlases provide a nearly hemispheric view of hydroclimate variability provides an incredible amount of information that can be used to better understand what was happening in the atmosphere and ocean,“ Coats said.
In Europe and the Mediterranean, the new drought atlas expands scientists’ understanding of climate conditions during historic famines. For instance, an unusually cold winter and spring are often blamed for a 1740-1741 famine in Ireland. The Old World Drought Atlas points to another contributor: rainfall well below normal during the spring and summer of 1741, the authors write in the paper. The atlas shows how the drought spread across Ireland, England and Wales. The atlas also tracks the reach of the great European famine of 1315-1317, when historical documents describe how excessive precipitation across much of the continent made growing food nearly impossible. The atlas tracks the hydroclimate across Europe and shows its yearly progressions from 1314 to 1317 in detail, including highlighting drier conditions in southern Italy, which largely escaped the crisis.
The atlas may also help shed light on more recent phenomena, including a record 2006-2010 drought in the Levant that a recent Lamont study suggests may have helped spark the ongoing Syrian civil war. The North America atlas, published in 2004, has been used by other researchers to suggest that a series of droughts starting around 900 years ago may have contributed to the eventual collapse of native cultures. Likewise, the Asia atlas, published in 2010, has led researchers to connect droughts, at least in part, to the fall of Cambodia’s Angkor culture in the 1300s, and China’s Ming dynasty in the 1600s.
The tree ring data used to create the new atlas included cores from both living trees and timbers found in ancient construction reaching back more than 2,000 years. They come from 106 regional tree ring chronologies, each with dozens to thousands of trees, and were contributed to the project by the International Tree Ring Data Bank and European tree-ring scientists.
Vielleicht sollten Modellierer die realen Dürreereignisse etwas besser studieren und verstehen, bevor sie ihre Rechenkästen anschmeißen. Tallaksen & Stahl wiesen im Januar 2014 auf noch immer bestehende riesige Diskrepanzen in Europa zwischen modellierter virtueller und dokumentierter realer Welt.


